Login & Dashboard
Logging In
Section titled “Logging In”- Navigate to
https://admin.merq.id - Enter your Email and Password
- Click Sign In
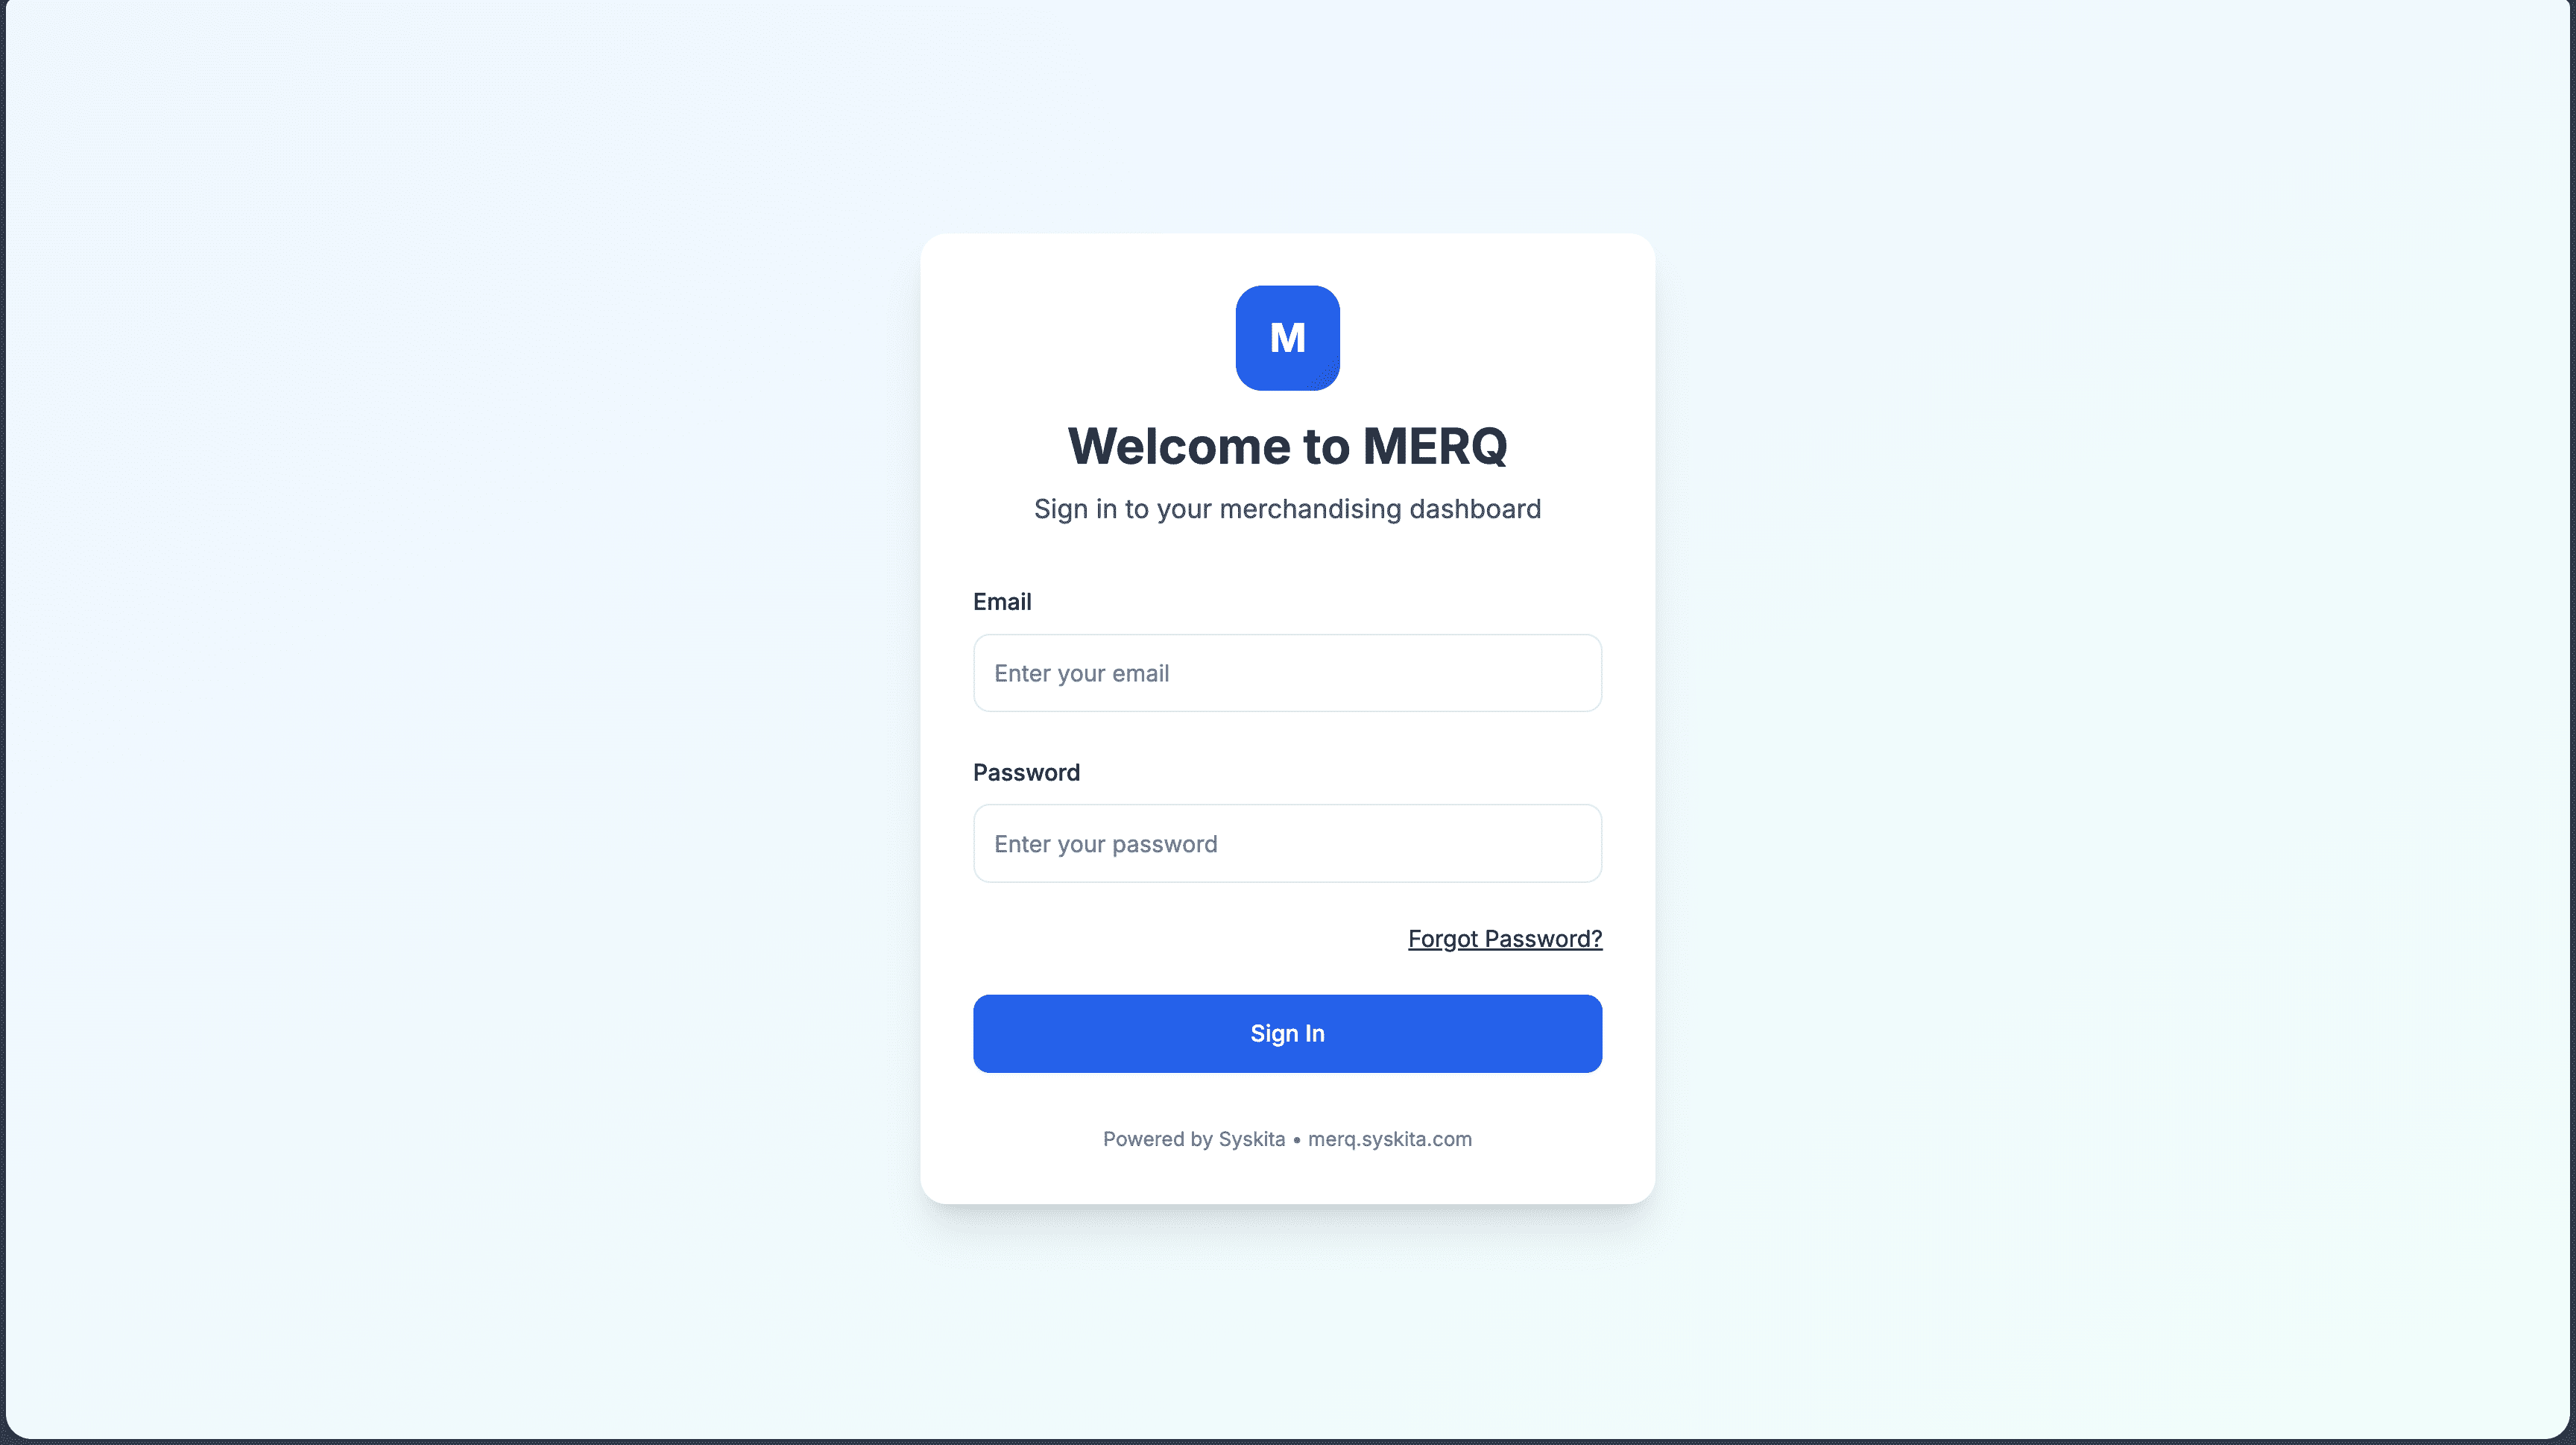
If your account belongs to multiple workspaces, you will be prompted to select a workspace before proceeding.
Dashboard Overview
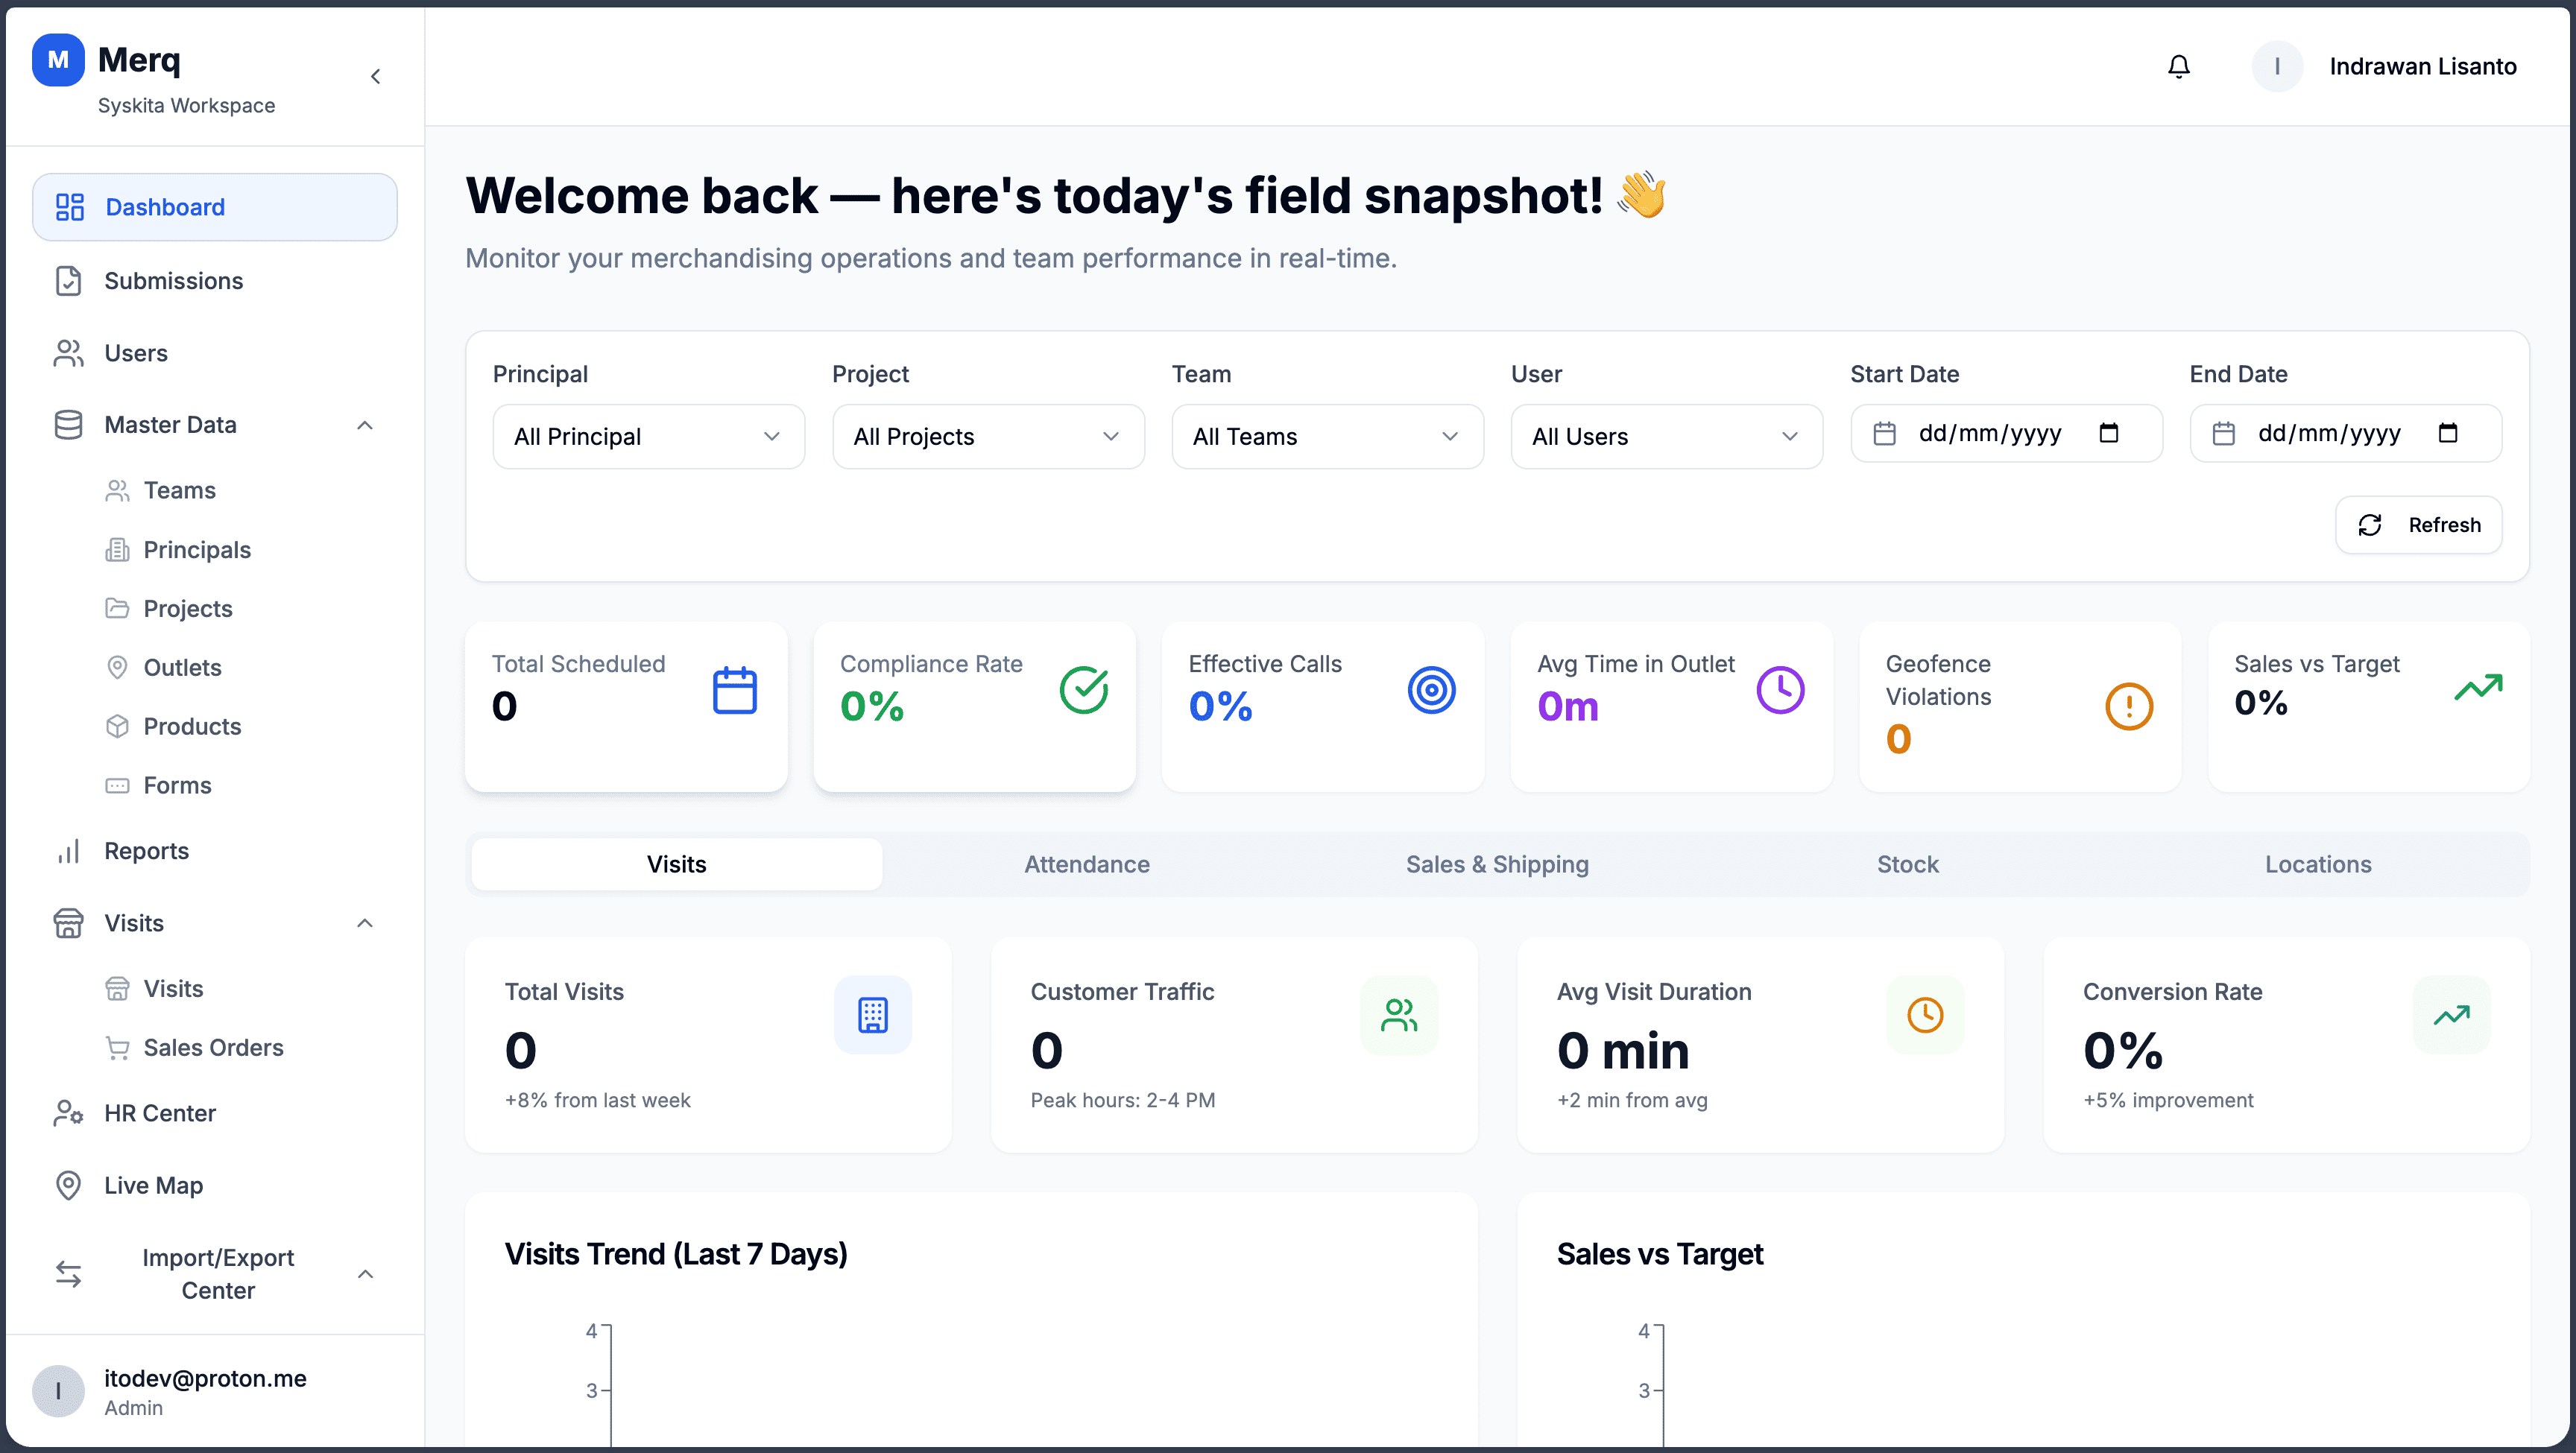
Section titled “Dashboard Overview”After logging in you land on the Dashboard — the central overview of your field force operations.
Filter Bar
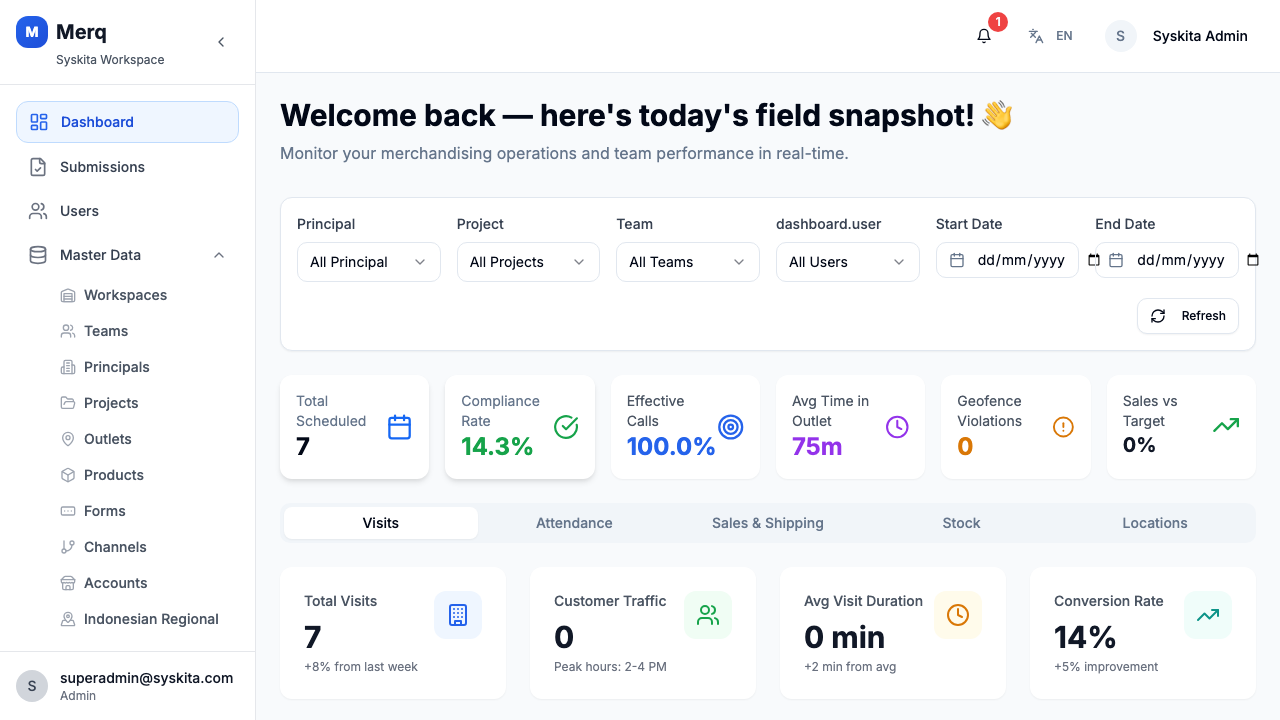
Section titled “Filter Bar”At the top of the dashboard, a filter bar lets you narrow all metrics and charts by:
| Filter | Description |
|---|---|
| Principal | Filter by client brand |
| Project | Filter by operational project |
| Team | Filter by team |
| User | Filter by individual frontliner |
| Start Date / End Date | Date range for all metrics |
KPI Metric Cards
Section titled “KPI Metric Cards”Six summary cards display key performance indicators for the selected filters:
Performance Charts
Section titled “Performance Charts”The dashboard includes two charts:
- Visits Trend — Line chart showing daily visit counts for the last 7 days
- Sales vs Target — Bar chart comparing sales achieved vs. target for the last 3 months
Top Performing Users
Section titled “Top Performing Users”A ranked list of frontliners with the highest performance scores for the selected period.
Live Activity Feed
Section titled “Live Activity Feed”A real-time feed of the most recent submissions from field staff, showing outlet name, frontliner, and submission time.
KPI Tabs
Section titled “KPI Tabs”The KPI Tabs section provides a breakdown of performance metrics grouped by category (e.g., visit compliance, stock coverage, sales achievement).
Quick Actions
Section titled “Quick Actions”Shortcut buttons for common tasks:
- Create Visit
- Add Outlet
- Add User
- Export Report
Logging Out
Section titled “Logging Out”Click your profile avatar in the top-right corner and select Logout.